Dashboard Stats
Dashboard stats allow you to display the summed value of number fields and display time elapsed details of date & time fields from a Status Board on the Dashboard.
🔑 ACCESS LEVEL: Account Owner
Displaying Total Numbers


⚠️ ATTENTION: As this only works with number fields you must first have a number field on your status board template.
- Go to the Admin Area
- Expand Templates
- Click the Edit icon on the status board you wish to edit
- Scroll to the bottom of the page and click +Advanced Options
- Click Add next to Dashboard stats
- In this article's example to display the summed value for both Shelter Capacity and Shelter Occupancy on the dashboard you must obtain the field IDs for both of the number fields
- Click the ⋮ more options menu icon and copy the Field ID, you can also click on the double paper icon to copy
- The field IDs for Shelter Capacity is shelter_capacity_Fxd9LCYq and the field name for Shelter Occupancy is shelter_occupancy_fQS9eJ91

- To sum the total number for Shelter Capacity and display it on the dashboard, enter the following in Value expression:
- {{items | map:'data.shelter_capacity_Fxd9LCYq' | add}}
- Click Add
- To sum the total number for Shelter Occupancy and display it on the dashboard, enter the following in Value expression:
- {{items | map:'data.shelter_occupancy_fQS9eJ91' | add}}
- This is what it should look like in your account. Whatever you enter in the Label box will appear as the label on the dashboard

- Click Save
- Select OK to confirm save
Filtering by Status
To calculate the total number of entries based on a selected status field.

- Go to the Admin Area
- Expand Templates
- Click the Edit icon on the status board you wish to edit
- Scroll to the bottom of the page and click +Advanced Options
- Click Add next to Dashboard stats
- In the example from this article, to display the total entries for Road Closures based on the selected Status on the dashboard, you’ll need to obtain the field IDs for the status field
- Click the ⋮ more options menu icon and copy the Field ID, you can also click on the double paper icon to copy

- To sum the total entries for Roads that are Closed and display it on the dashboard, enter the following in Value expression:
- {{(items | filterBy:['data.current_status_k4Mnbx1N']:'closed').length}}
- Click Add
- To sum the total entries for Roads that are Open, One Lane and display it on the dashboard, enter the following in Value expression:
- {{(items | filterBy:['data.current_status_k4Mnbx1N']:'open_one_lane'').length}}
- This is what it should look like in your account. Whatever you enter in the Label box will appear as the label on the dashboard

- Enter in true under the expression to showcase the color on the dashboard (green=success, amber=warning and/or danger=red
- Click Save
- Select OK to confirm save
Displaying Time Last Reported
Show the minutes since the last update based on what is entered into a date and time field.
⚠️ ATTENTION: As this only works with date and time fields you must first have a date and time field on your status board template.
- Go to the Admin Area
- Expand Templates
- Click the Edit icon on the status board you wish to edit
- Scroll to the bottom of the page and click +Advanced Options
- Click Add next to Dashboard stats
- In this article's example to display the time elapsed for Flood Zones/Risk Last Reported Time on the dashboard you must obtain the field IDs for both of the number fields
- Click the ⋮ more options menu icon and copy the Field ID, you can also click on the double paper icon to copy
- The field ID for Time Reported is report_date_and_time_YE6DtZgd

- To display the number of minutes elapsed since the last Road Damage was reported, enter the following in Value expression:
- Time Since Last Update: {{items | pick:'data.report_date_and_time_YE6DtZgd != null' | max:'data.report_date_and_time_YE6DtZgd' | getProp:'data.report_date_and_time_YE6DtZgd' | minutesSince}} minutes ago
- Click Add
- This is what it should look like in your account. Whatever you enter in the Label box will appear as the label on the dashboard
- Click Save
- Select OK to confirm save

Dashboard Views
Display configured Default Sorting/Grouping/Filtering Status Board items on the dashboard.
⚠️ ATTENTION: Before proceeding, configure the Default Sorting/Grouping/Filtering on your status board template, or you can choose to set All Items which is the default displaying all field data.
- Go to the Admin Area
- Expand Templates
- Click the Edit icon on the status board you wish to edit
- Scroll to the bottom of the page and click +Advanced Options
- Click +Add next to Dashboard views
- Select one of the options from the drop down
- Click Save
- Select OK to confirm save
- Repeat steps to create multiple sorting/grouping/filtering views on the dashboard
Display Modes
Depending on configured the Default Sorting/Grouping/Filtering on your status board template, the dashboard display will differ.
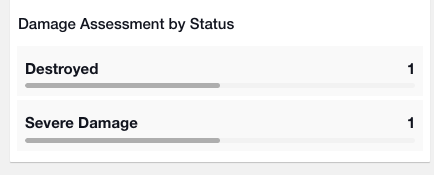
- Option 1: Grouping view; will display the group name and count. The progress bar on the dashboard widget indicates the proportion of all items that this grouping represents.


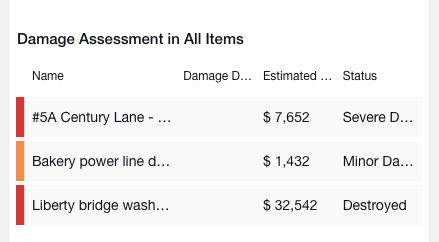
- Option 2: No grouping view; will display a list of the first ten items according to the configured sorting order and the grid columns.


